
Modeling Healthcare Access in U.S. Counties
Exploring Socioeconomic and Environmental Determinants through Advanced Analytics - Best Counties to Live in the U.S.: A Data-Driven Approach to Healthcare Access and Quality of Life
Problem Overview:
Best Counties to Live in the U.S.: A Data-Driven Approach to Healthcare Access and Quality of Life
This project explores county-level patterns in healthcare access, affordability, and quality of life across the United States. It was developed as part of a broader portfolio initiative to identify the most suitable counties for four key demographic groups: young families, first-generation immigrants, recent graduates, and empty nesters. These groups face unique constraints related to income, housing, healthcare, and community integration, and this project seeks to provide actionable, data-informed insights tailored to their needs.
This project carried out as my fully independent as Advanced Analytics module of the Data Analyst Bootcamp, from data sourcing and cleaning to modeling and visualization, all components were designed, executed, and presented by me to demonstrate both technical skill and storytelling through data.
Data Sourceing & Preparation
Data sourcing and preparation accounted for nearly three-quarters of the total project effort. The resulting clean dataset was designed not only to power this analysis, but also to serve as a foundation for future projects under the Best Counties to Live in the U.S. portfolio. A downloadable version of the dataset will be published to my personal Kaggle repository to promote transparency and encourage reuse.
To ensure a comprehensive and geographically consistent analysis, eight authoritative datasets were sourced from publicly available U.S. federal and non-profit repositories. The data spans 2019 to 2024 and offers broad coverage across socioeconomic, health, environmental, and housing indicators at the county level.
All datasets were merged using FIPS codes to maintain geographic integrity across all 3,143 U.S. counties. The final master dataset includes over 500 variables, making it well-suited for advanced spatial, statistical, and machine learning analyses.
Preprocessing & Standardization
The datasets underwent detailed preprocessing, including:
- De-duplication, renaming, and column standardization
- State-level mean imputation for missing values (by year and variable)
- Z-score normalization to compare indicators on a common scale
- Removal of unused or sensitive fields, such as margin-of-error columns
Where applicable, multi-year averages were computed to create more stable indicators. Demographic fields were consolidated into standard federal age brackets, and the Simpson Diversity Index was calculated to measure racial and ethnic diversity.
This project was developed primarily using the Health & Social Metrics dataset from the County Health Rankings & Roadmaps (UW + RWJF, 2020–2024), which served as the backbone of the analysis.
Full data sources and the cleaned dataset are available in my GitHub repository and will also be published on my Kaggle profile.
Limitations
While this project offers meaningful insights into healthcare access at the county level, several limitations should be acknowledged:
Statistical Limitations
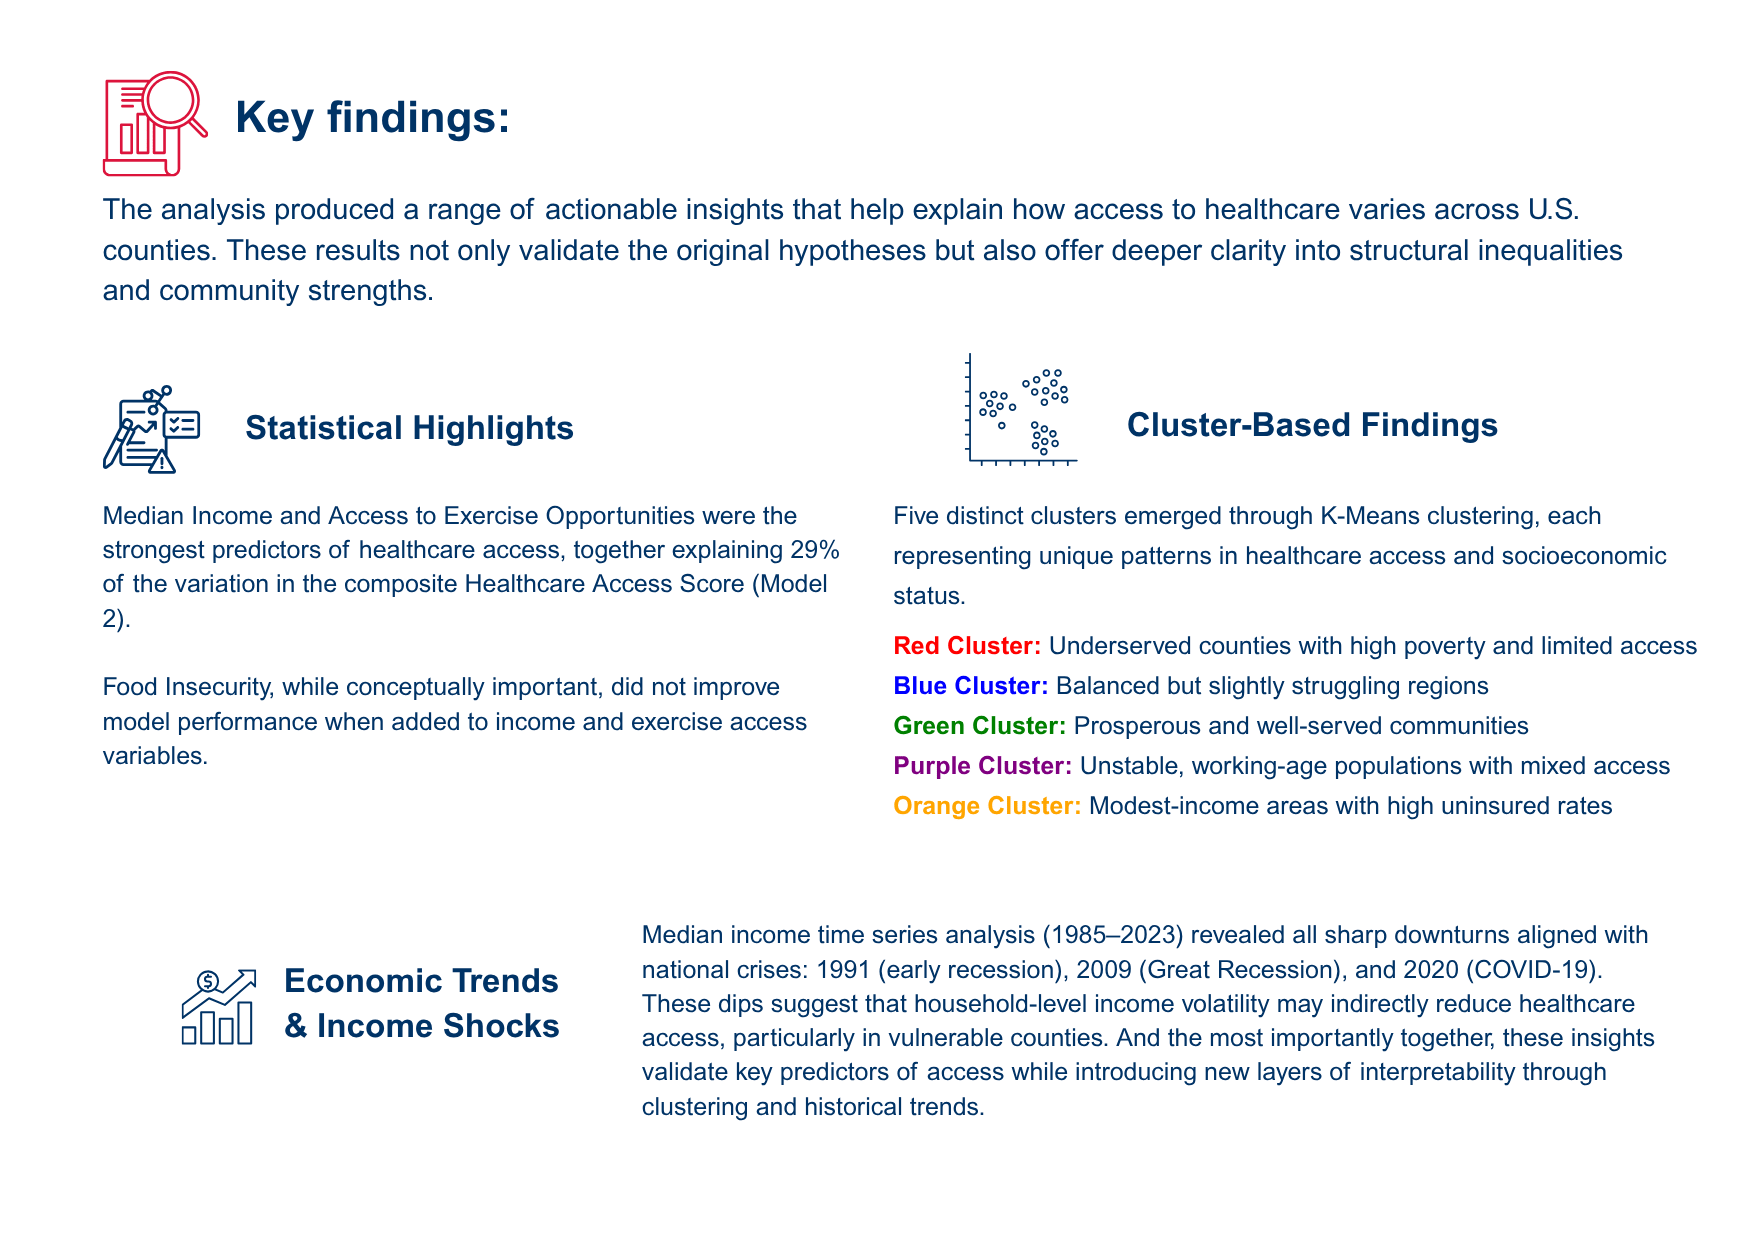
The regression model explains only 29% of the variance in healthcare access, suggesting many unmeasured factors may be influencing outcomes.
A linear model was used; more complex relationships may exist but were not captured through this method.
Results may not generalize beyond the U.S. county-level context or to specific populations without further adaptation.
Data Quality & Coverage
The analysis relies heavily on American Community Survey (ACS) and County Health Rankings data, both of which carry an estimated ±12% margin of error, particularly in smaller counties.
Some variables (e.g., insurance rates, preventive screenings) may reflect lagging indicators or vary in how consistently they are reported.
Data smoothing (e.g., 5-year averages) improves stability but may obscure short-term shocks or emerging disparities.
Variable Constraints
Only a subset of relevant indicators (13 core variables) were selected for modeling to maintain interpretability and data consistency.
Variables like healthcare provider density, transportation access, or state policy differences were not included but could enhance future models.
Despite these constraints, the analysis offers a scalable framework and a transparent methodology that can be extended, refined, or replicated in future studies based on the clean and preposesesed dataset.